Zoekresultaten voor: ‘bootstrap studio graph’
- Gerelateerde zoektermen
- graphic design course best in it industry tamil
- Graph the function f(x)= – 5(x 7)2–4. Plot the vertex. Then plot another point on the parabola. If you make a mistake, you ca
- Graph the function f(x)=x2 9. Plot the vertex. Then plot another point on the parabola. If you make a mistake, you can erase yo
- graphics work with visa sponsorship in the UK
- Studio R 17
-
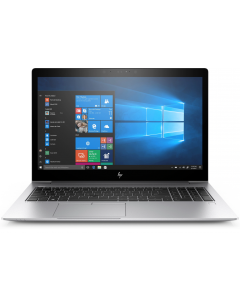
 HP Elitebook 850 G5 Intel Core i5 7200U | 8GB DDR4 | 256GB SSD | 15,6 inch | Full HD 1920 x 1080 | Windows 10 Pro | GebruiktSpecial Price € 199,00 € 164,46 Regular Price € 249,00
 -
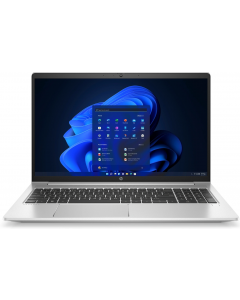
 HP Elitebook 850 G6 Intel Core i5 8265U | 16GB DDR4 | 256GB SSD | 15,6 inch | Full HD 1920 x 1080 | Windows 11 Pro | GebruiktSpecial Price € 275,00 € 227,27 Regular Price € 289,00
 -
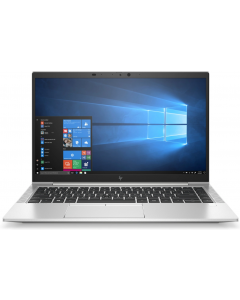
 Dell Latitude 5410 Intel Core i5 10310U | 16GB DDR4 | 256GB SSD | 14 inch Touchscreen | Full HD 1920 x 1080 | Windows 11 Pro | GebruiktSpecial Price € 279,00 € 230,58 Regular Price € 299,00