Zoekresultaten voor: ‘graph powerpoint change colour of one grid line’
- Gerelateerde zoektermen
- grid code for large solar plants in spain
- changes to mail in ios 18.3
- grid r 17 5x100
- change a video to jpg
- CHANGE OF BROKER FORM
-
 Lenovo V110-15ISK V110-15IKB Palmrest Top CaseSpecial Price € 19,50 € 16,12 Regular Price € 39,00
 -
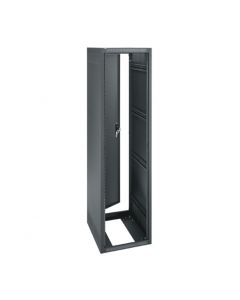 Server Rack Middle Atlantic 44SP-20D STANDALONE RACKSpecial Price € 199,00 € 164,46 Regular Price € 749,00
 -
 Aruba AP0103 Access PointSpecial Price € 49,00 € 40,50 Regular Price € 119,00
 -
 Cisco SPA112 2-poorts Voip telefoon adapter | Zonder VoedingsadapterSpecial Price € 49,00 € 40,50 Regular Price € 85,00