Zoekresultaten voor: ‘graph powerpoint change colour of one grid line’
- Gerelateerde zoektermen
- grid code for large solar plants in spain
- changes to mail in ios 18.3
- grid r 17 5x100
- change a video to jpg
- CHANGE OF BROKER FORM
-
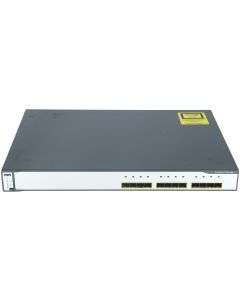 Cisco WS-C3750G-12S-S | 12 Ports SFP Managed | StackableSpecial Price € 29,00 € 23,97 Regular Price € 59,00